
Space Radar Monitoring LIVE 24-7 Magnetics Solar Data Feeds
↕️
![]()
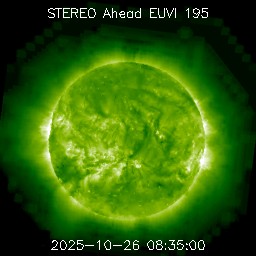
EARTH POSITION "Your Viewing Point" Close Up SUN section
↕️
![]()
EARTH POSITION "Your Viewing Point" WIDE Space Field View
Space Radar Monitoring LIVE 24-7 Magnetics Solar Data Feeds
ENLIL solar wind model:"This shows the Flares approach and direction Planets affected"
_____________
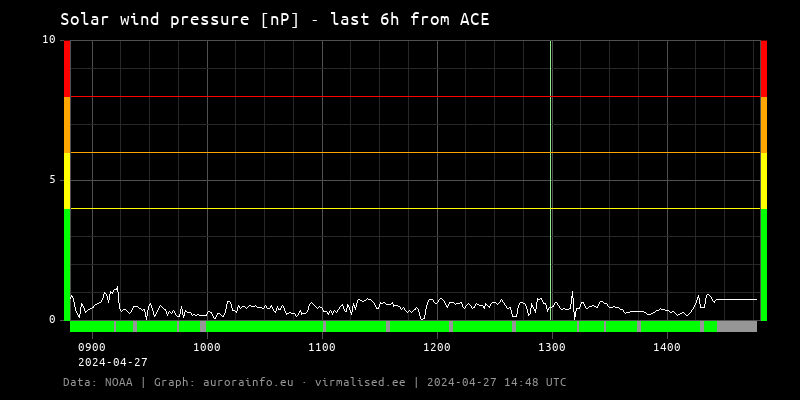
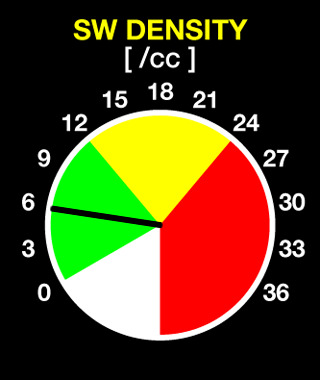
Current Solar Wind (SWPC)

"Magnetic NORTH Monitoring Last 24 hours live feed" Refresh Page if needed to update.


Earths Magnetic North Pole Shift, Pole Motion Latest Track Plotted Daily Monitored & Updated, includes predicted in red and actual past History.


ABOVE - Latest Earth CME Geomagnetic Intrusion Graph - GREEN = OK RED-Yellow-Orange = NOT GOOD BROWN = Holy Crap LOOK OUT !
STAR Active regions : "Live Snapshot of Coronal Holes which create Flares"

SDO / HMI Magnetogram :
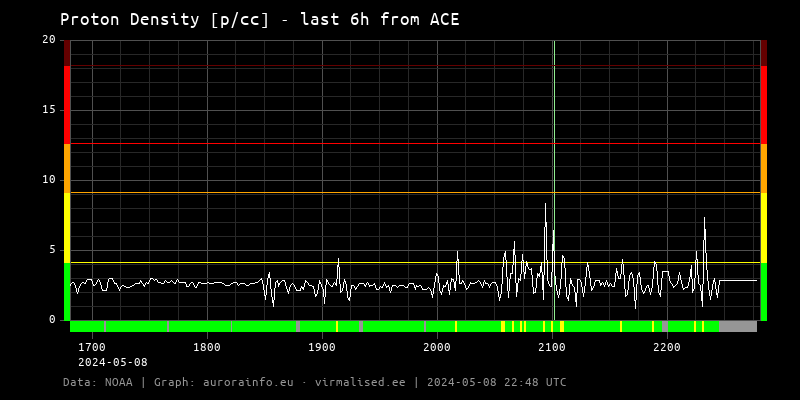

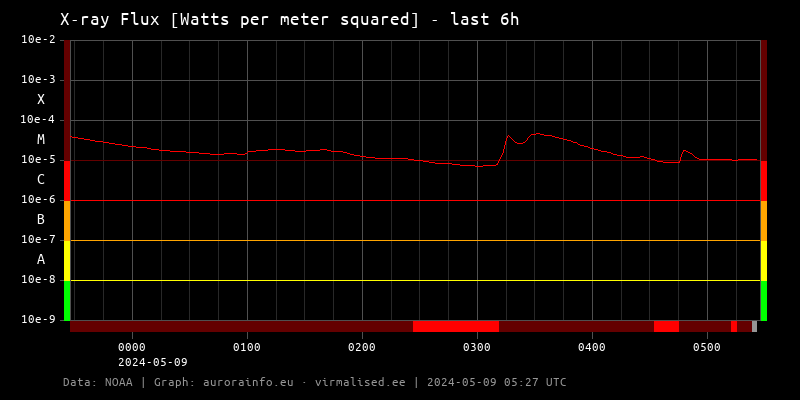
TEC Rate is the incoming Energy levels regions on Earth - X ray Earth Ingress in Watts per sq meter.

Solar Earth Intrusion Graph and data Plot Last 24 Hours
LATEST SUN IMAGES From SDO ..
BE Patient as it needs to run over grab latest Pics, sort it and then Play it.. so that takes a little time...
YOU MAY WANT TO ALSO CHECK OUR NEW Addition on Solar Sun Monitoring HERE .............

Earths Magnetic Solar Winds Reaction.
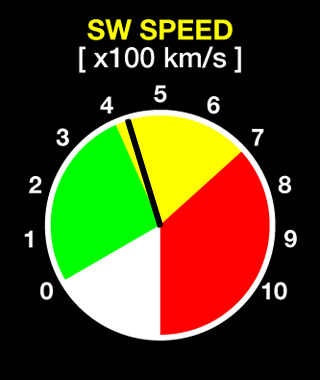
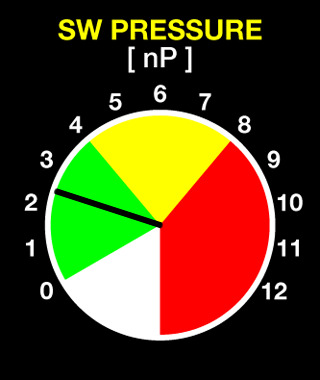
Description of above Monitors.

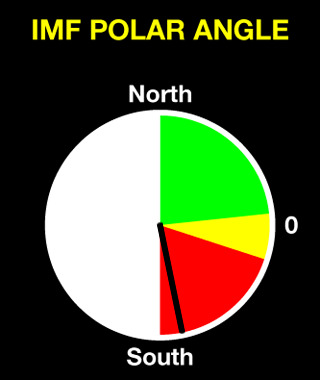

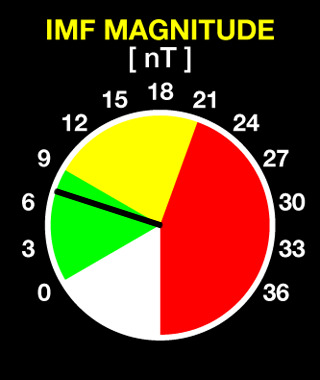
Interplanetary Magnetic Field Polar Angle:
(Derived) This quantity is the angle between the IMF and the geomagnetic axis. When the IMF is southward, antiparallel fields near the magnetospheric subsolar point allow merging between the IMF and geomagnetic fields. This process increases the transport of solar wind mass, momentum, and energy into the Earth's magnetosphere. This process can also open the magnetosphere to solar energetic particle radiation. In severe conditions this radiation can threaten high altitude aircraft in high latitude and polar regions. Under less severe conditions this radiation can still threaten polar orbiting spacecraft. This quantity depends on IMF components measured by ACE/MAG.
Realtime Global Ionosphere map:

Realtime Ionospheric Absorption — South Pole Antarctica Riometer (IPS-AU):


